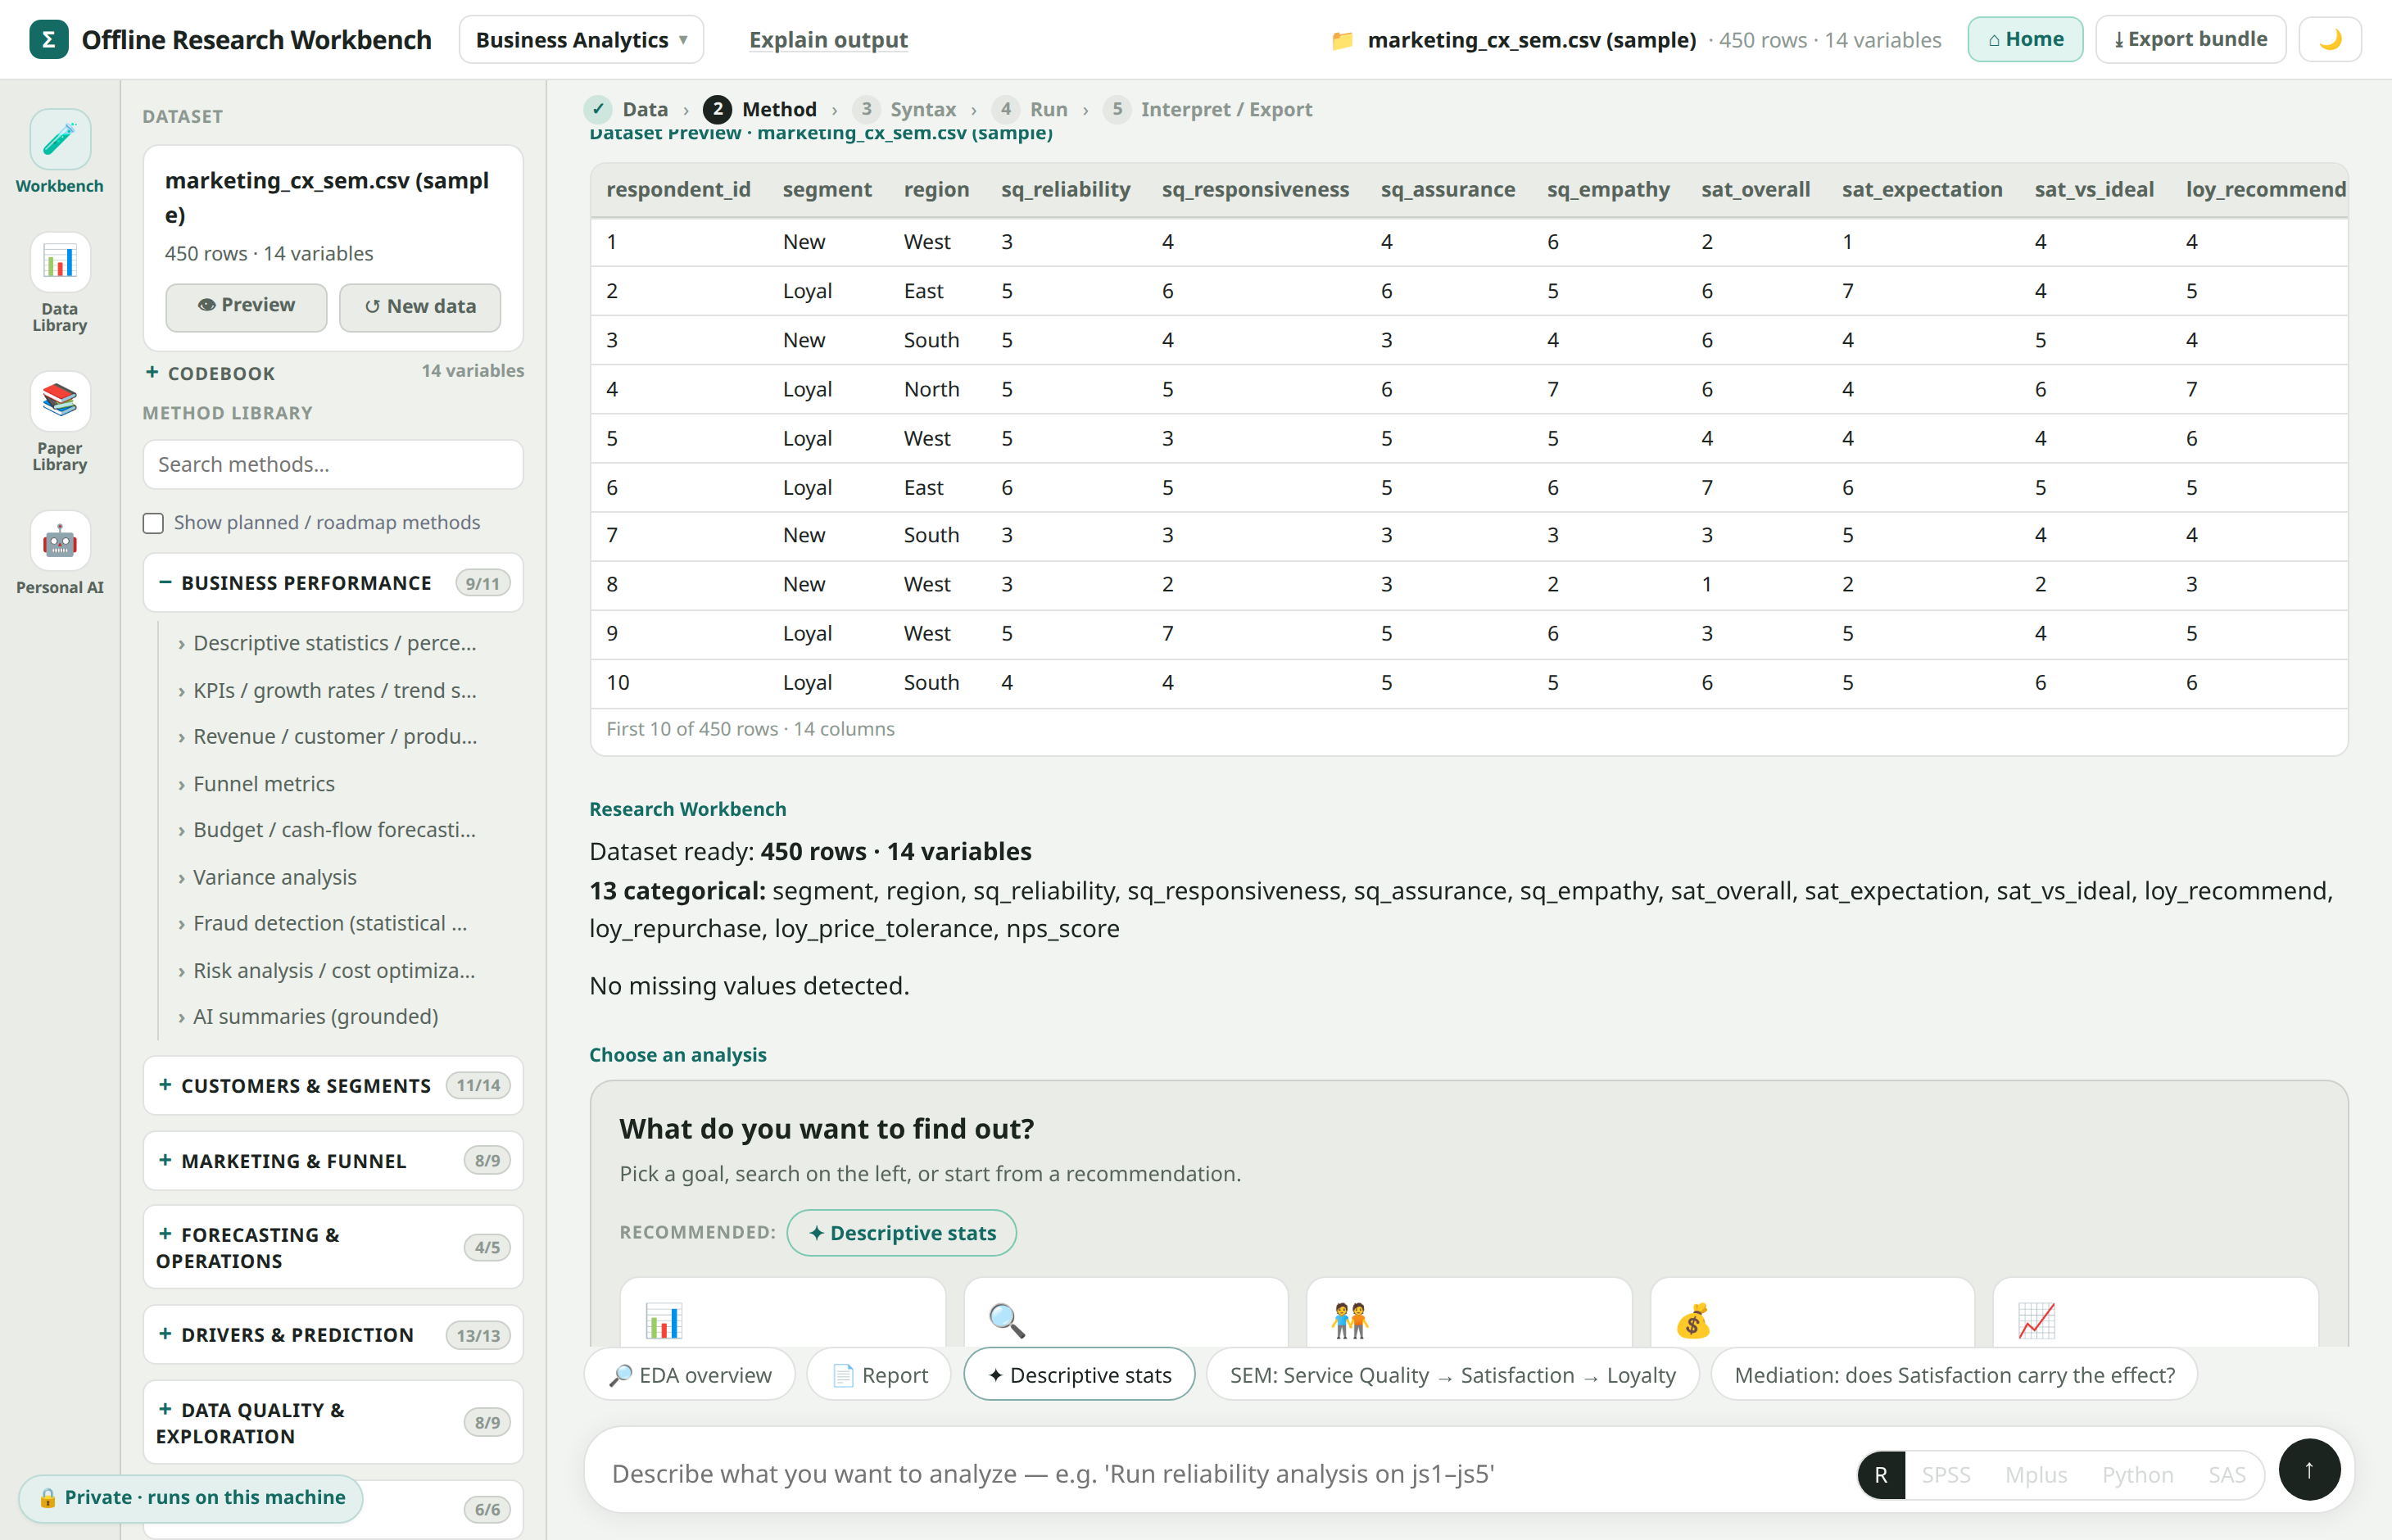
🔎 Explore your data
See what is actually in the file
Preview rows, variables, types, and data problems before choosing an analysis.
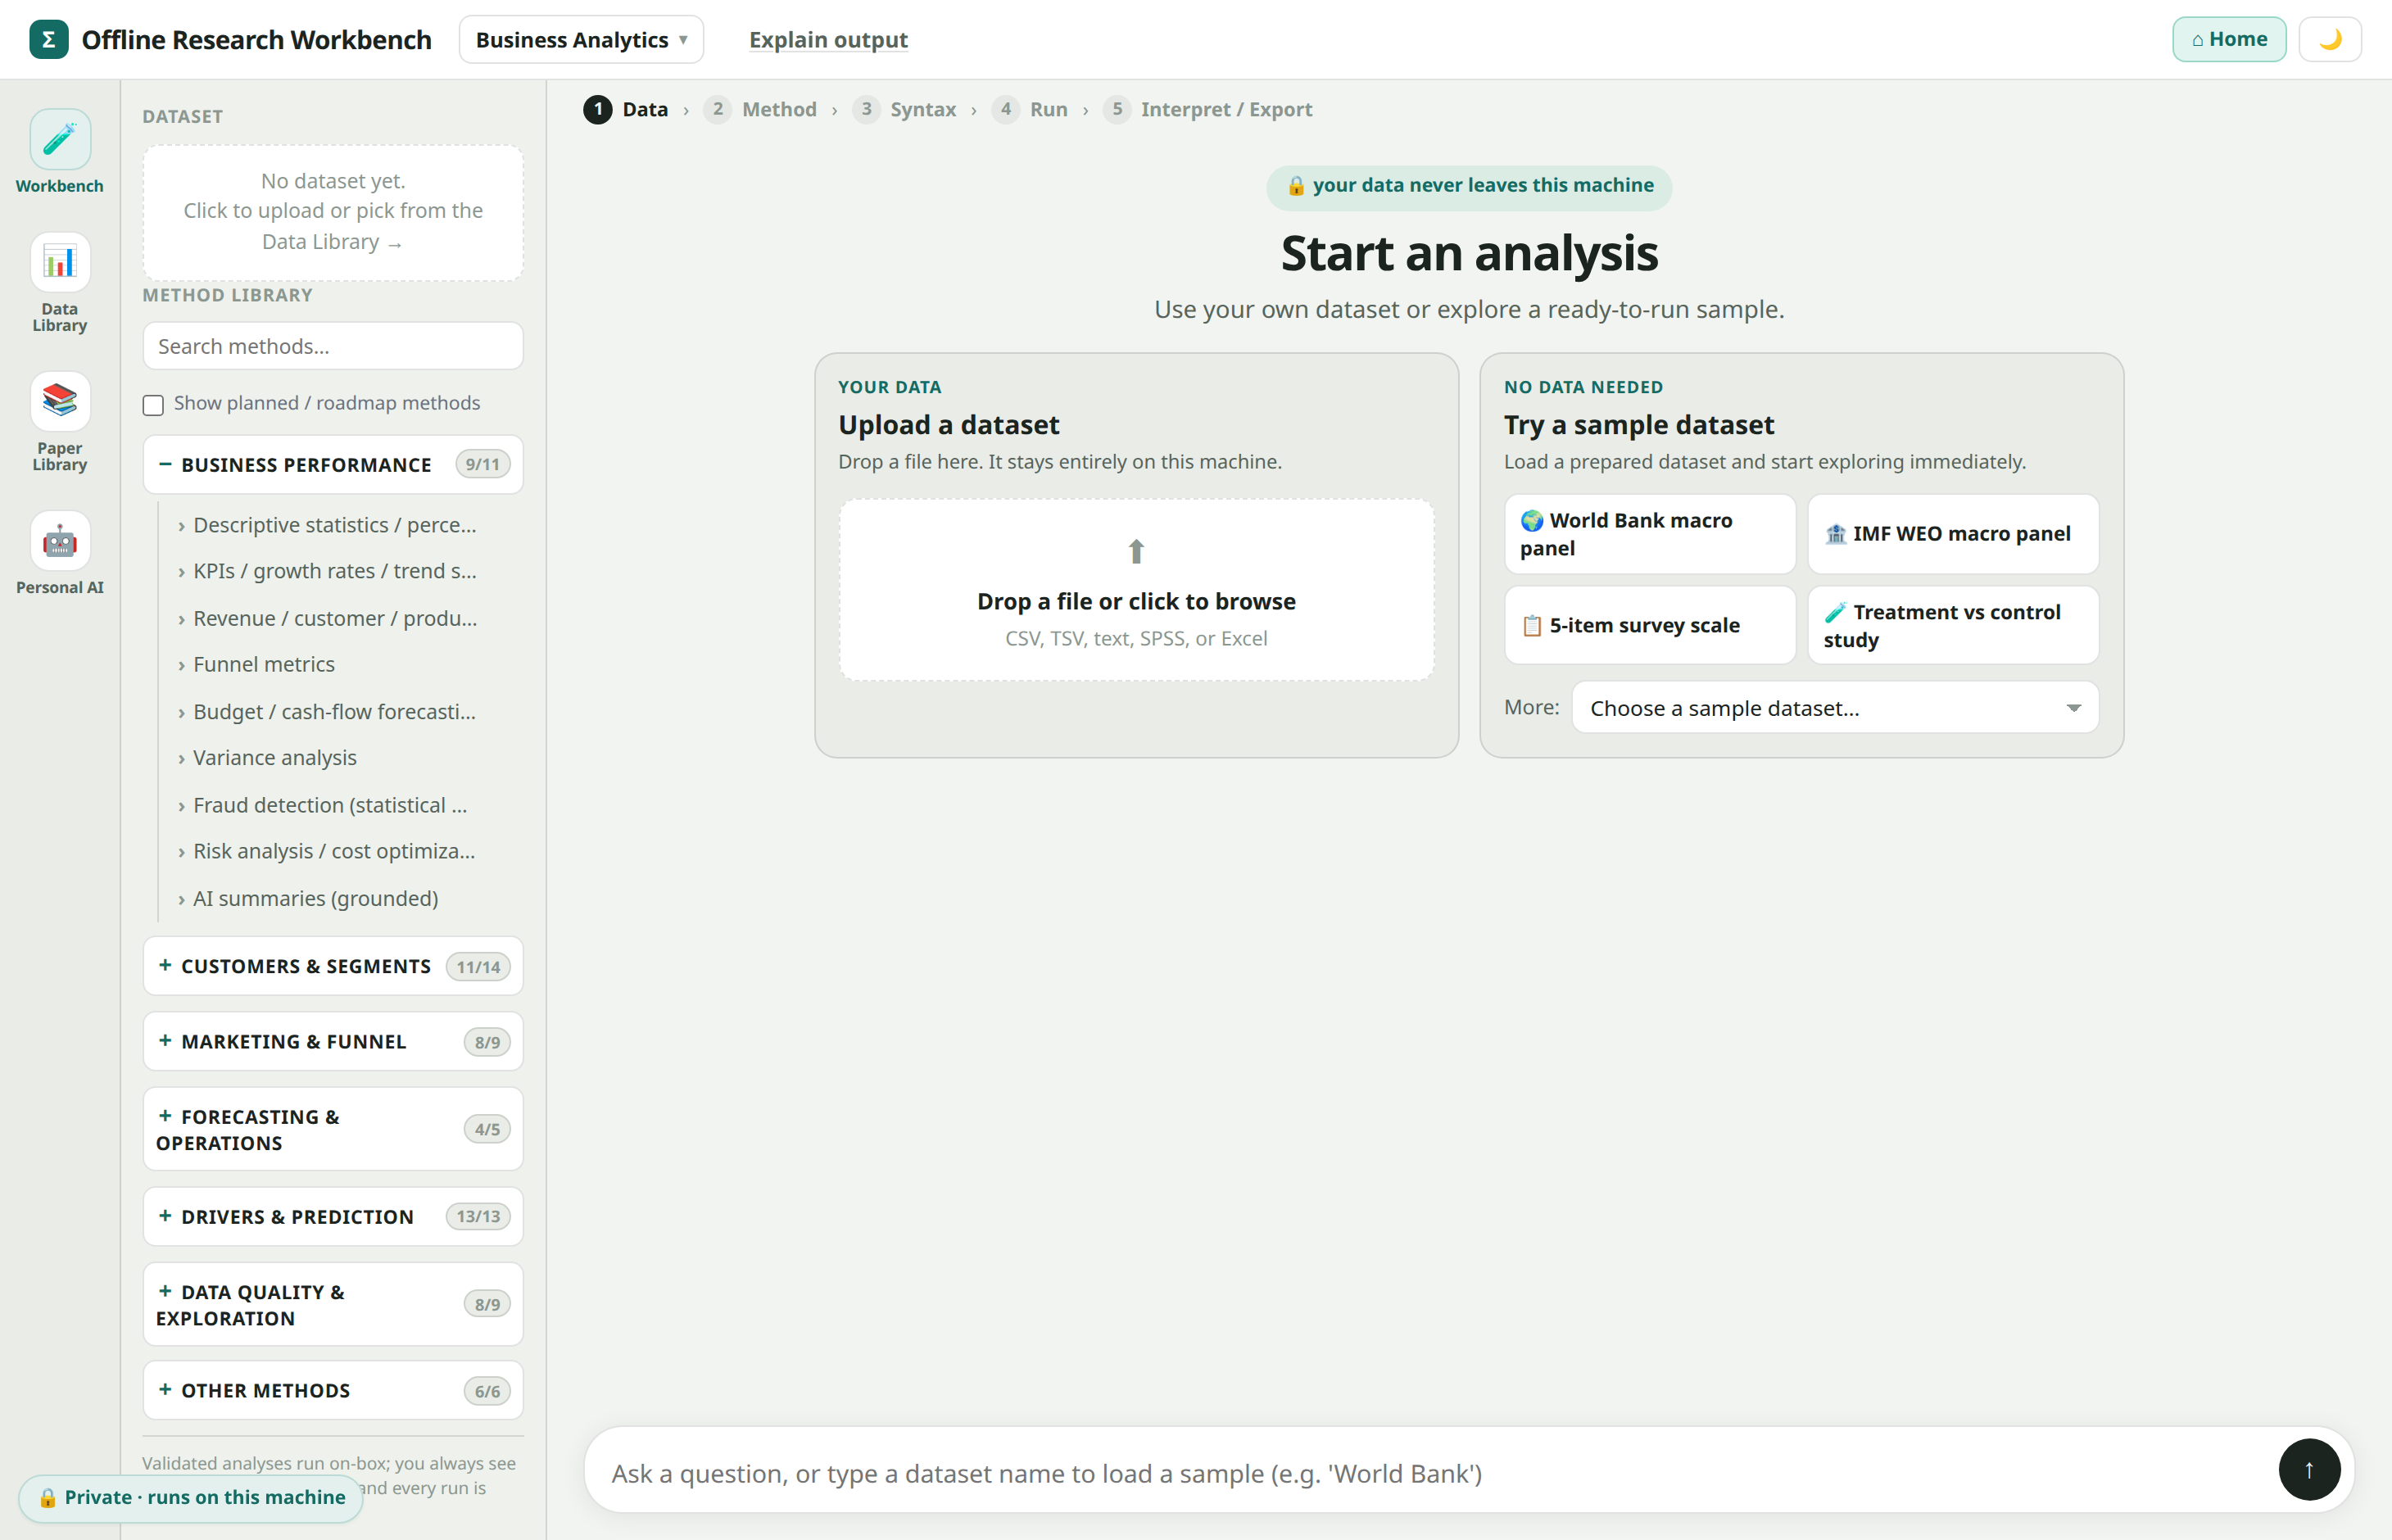
Upload a real dataset and start exploring. See your variables, find patterns, run appropriate analyses, and get clear results with every number traced back to the actual statistical output.
Load the dataset, explore what is inside, run an analysis that fits the real columns, and keep the evidence behind every conclusion.
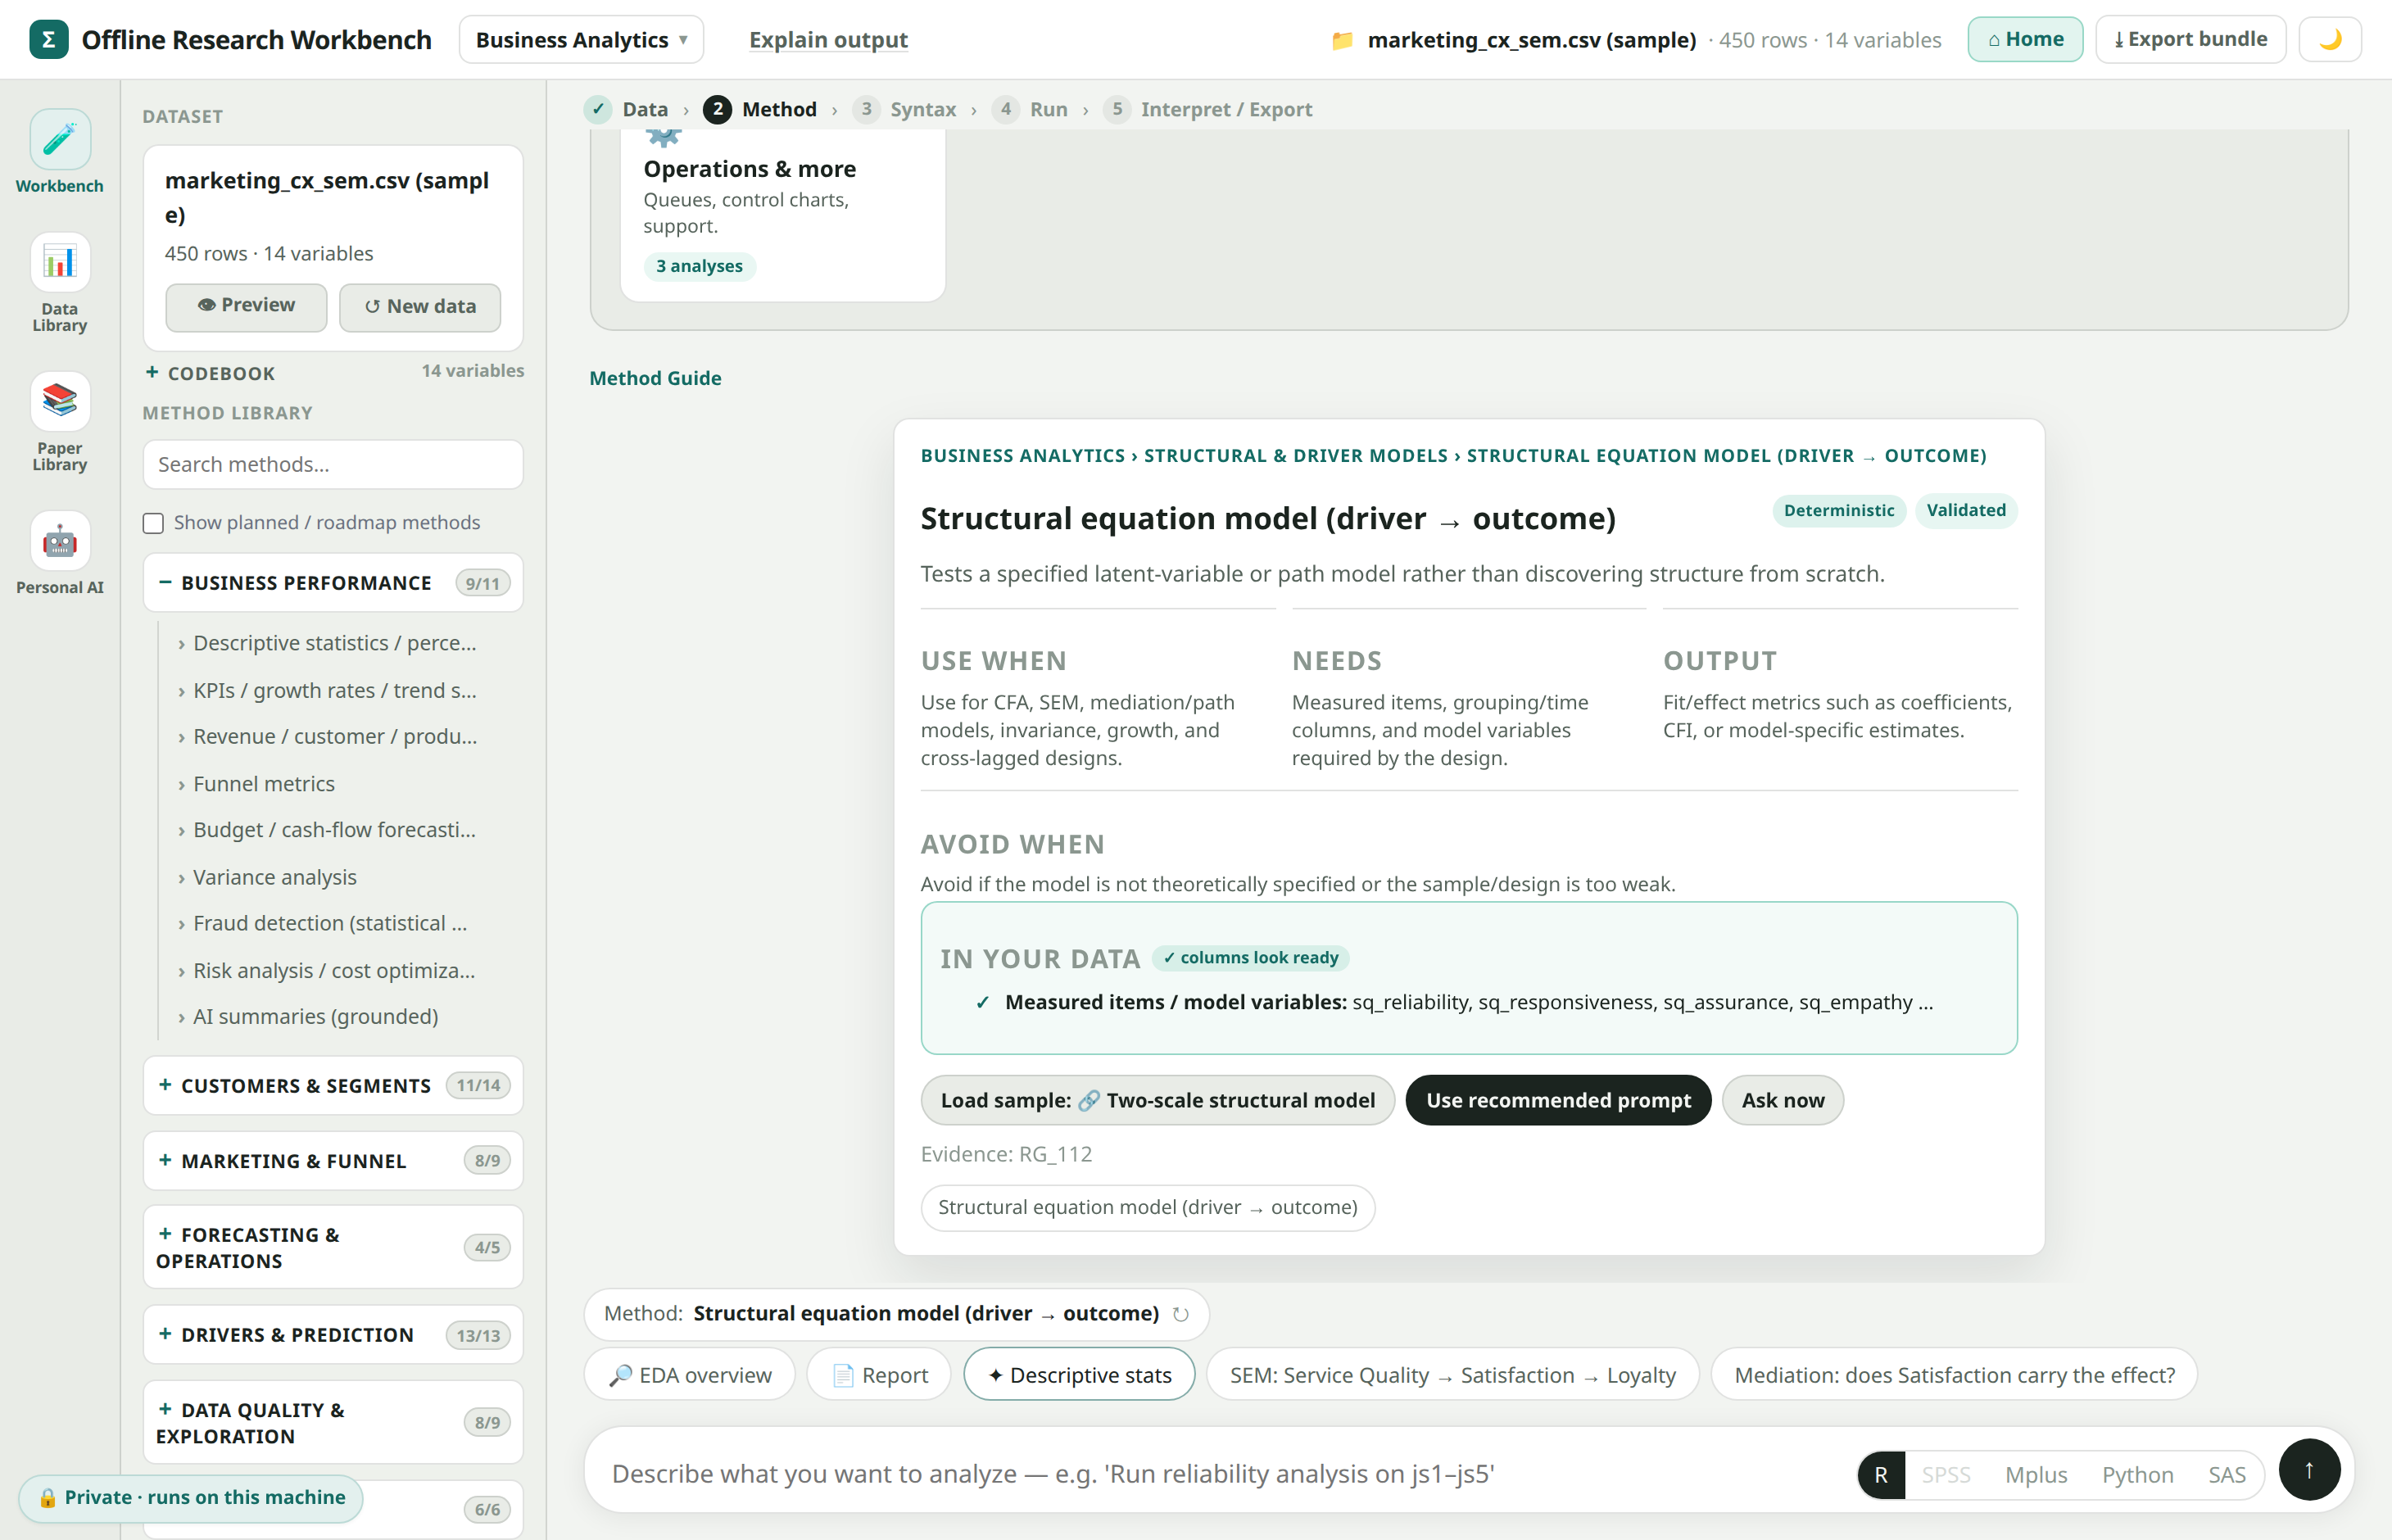
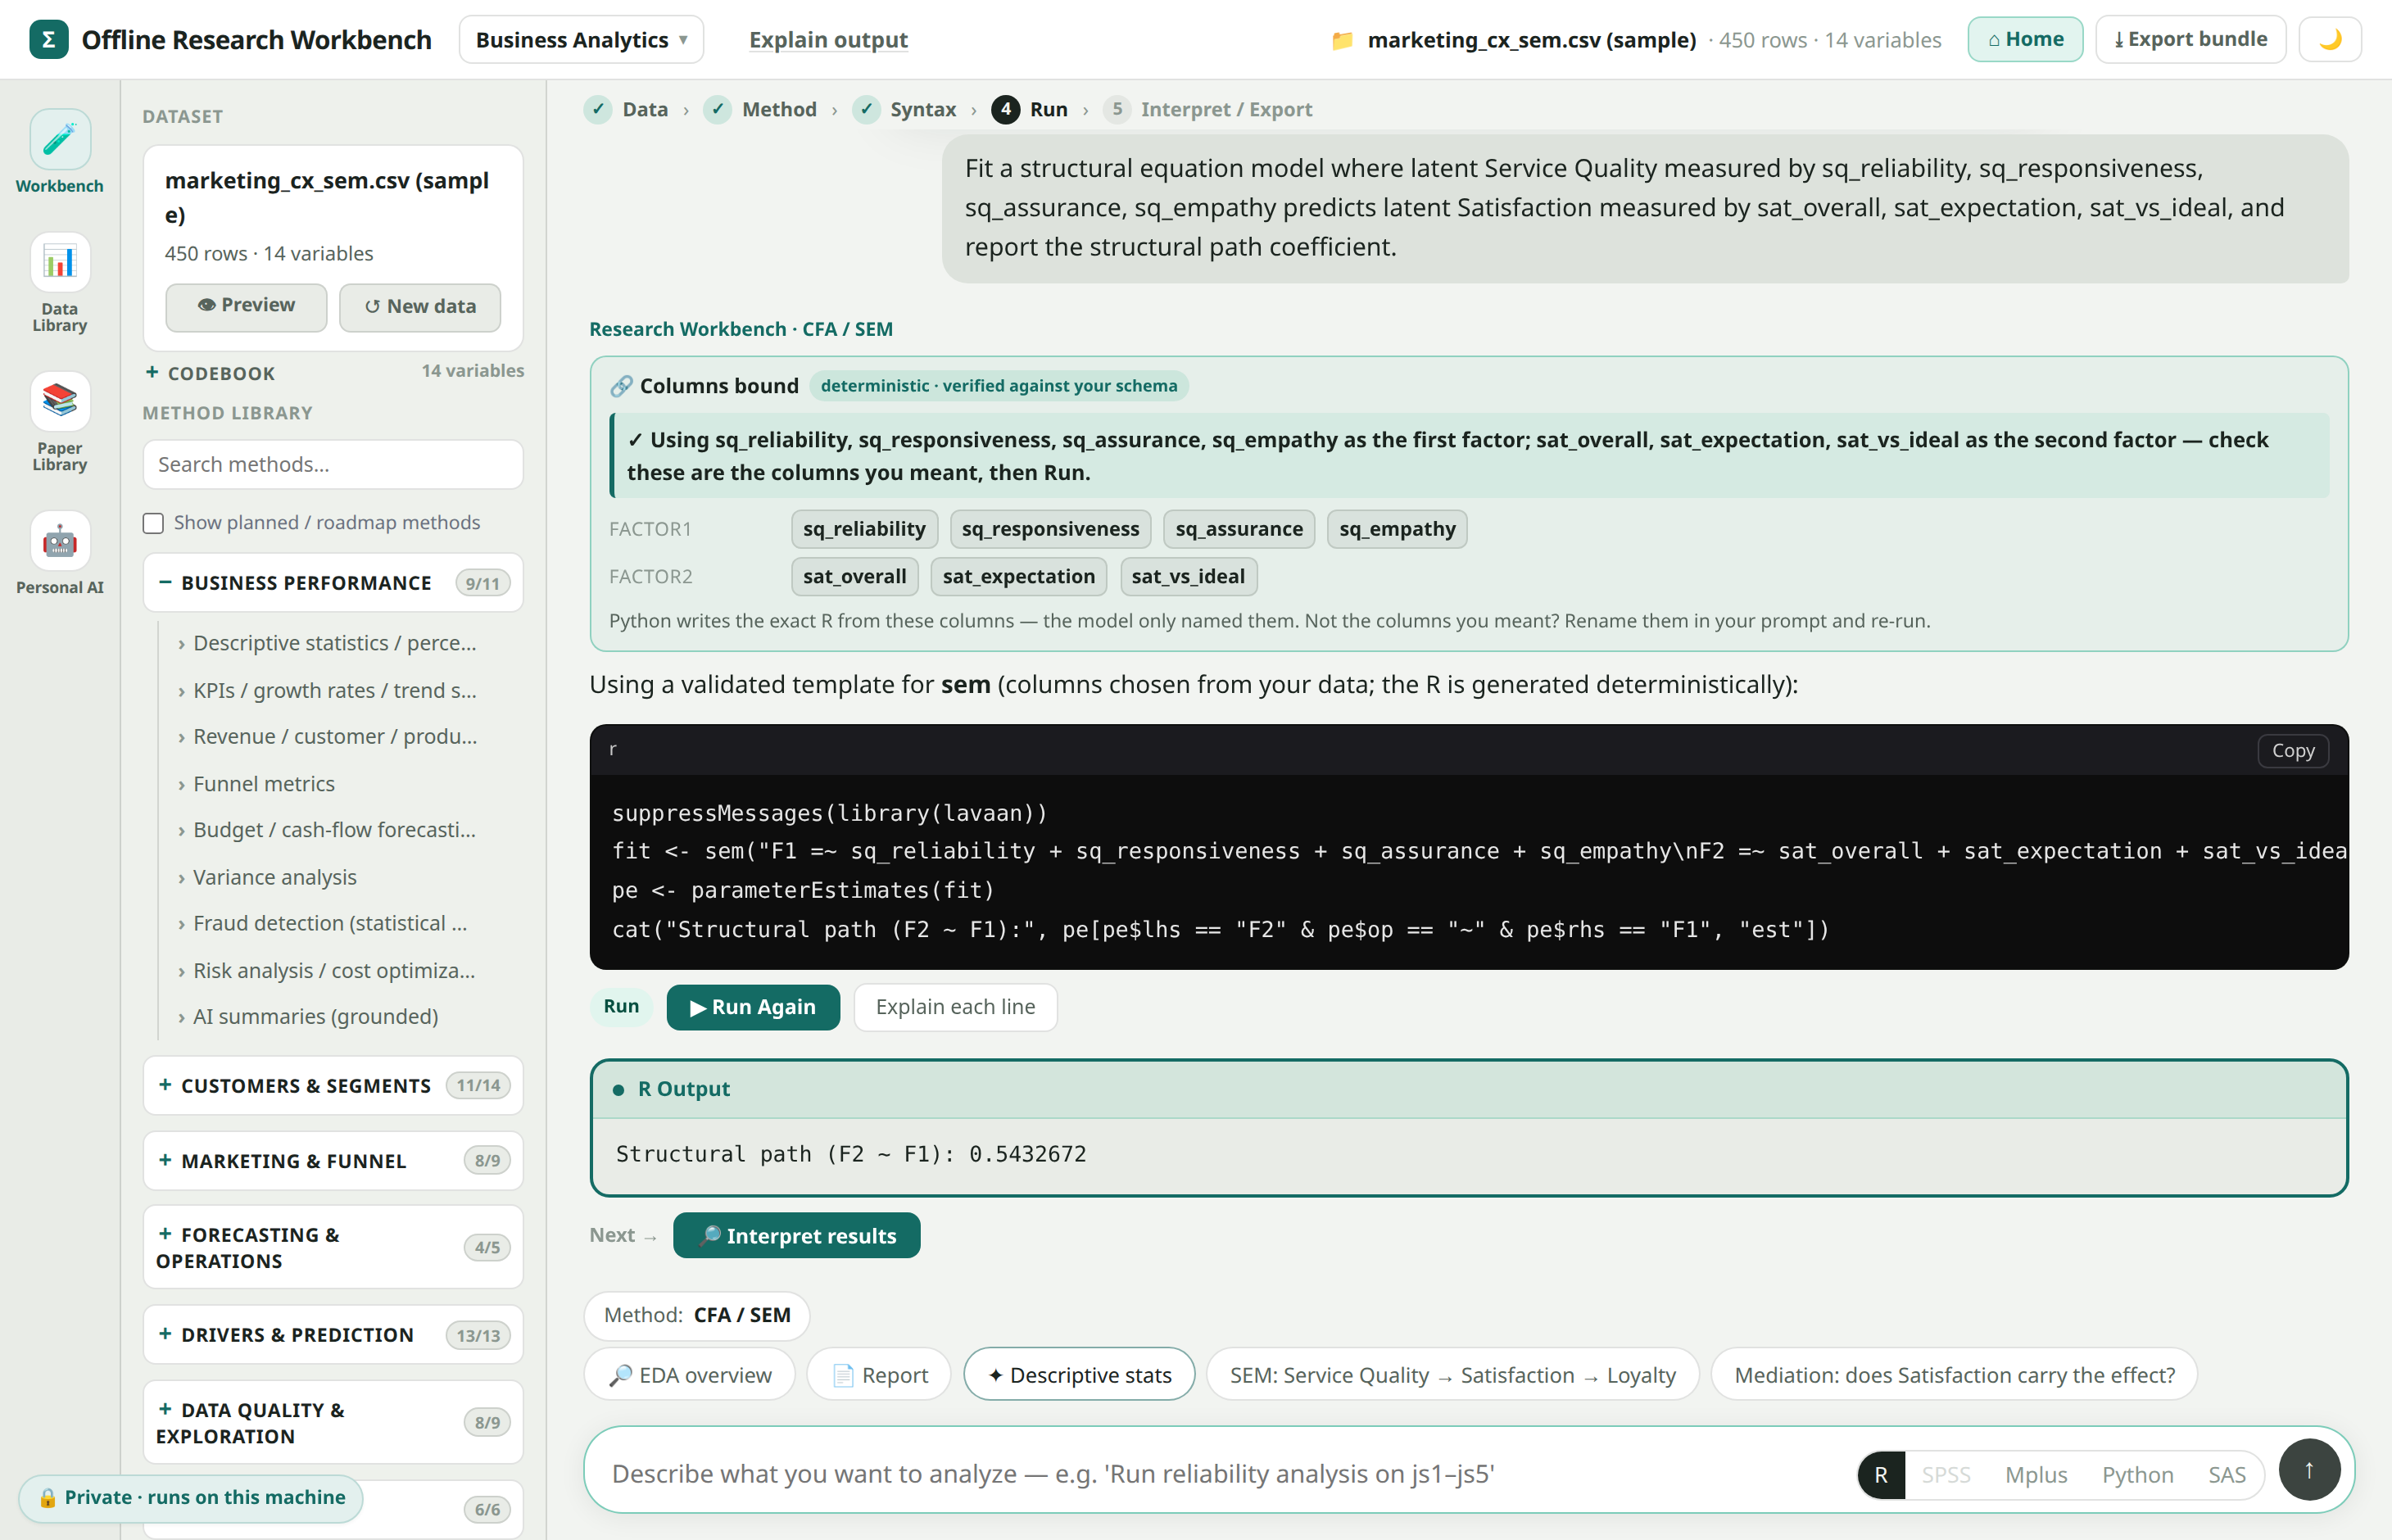
Exploration, method guidance, analysis, interpretation, and reproducible results in one workspace.
Preview rows, variables, types, and data problems before choosing an analysis.
See when to use it, what it needs, what to avoid, and whether your columns are ready.
Work in the browser without debugging packages, environments, or licenses.
Reported figures stay traceable to the executed code and statistical output.
Export the dataset, code, output, interpretation, and audit record together.
One guided workspace removes each obstacle between your dataset and a result you can trust.
OfflineAI combines plain-language assistance with explicit analysis state, local statistical execution, diagnostics, and reproducible outputs.
Conversation alone is not a durable or reproducible analysis record.
| Public AI limitation | OfflineAI design response |
|---|---|
| Conversations can become long, stale, or lose analysis context | Dataset, method, bindings, code, and results are tied to an explicit analysis session. |
| Results can depend on what remains in the chat context | Analysis runs from explicit dataset and method state. |
| It may calculate from samples, summaries, or invented values | Statistical code executes against the uploaded data. |
| Upload and context limits make substantial datasets awkward | The local analysis engine processes data outside the model context, subject to device and method limits. |
| A fluent answer can hide missing evidence | Result explanations are constrained by structured outputs, diagnostics, and claim boundaries. |
| Reproducing an earlier answer is difficult | Code, parameters, results, and reports can be retained and exported. |
| Sensitive data may be sent to an external service | Local/offline deployment keeps analysis inside the controlled environment. |
Traditional tools are powerful, but they often begin after the hardest workflow decisions.
| Traditional software friction | OfflineAI design response |
|---|---|
| Users often must already know which method to select | Guided method selection based on the research question and dataset. |
| Variable roles can be confusing | Shows the expected outcome, predictor, group, time, ID, weight, or before/after roles. |
| Column setup is manual and error-prone | Suggests compatible columns and asks users to confirm their meaning. |
| Dirty or unsuitable data can produce cryptic errors | Explains missing values, wrong types, sparse groups, small samples, and other problems. |
| Output often assumes statistical expertise | Explains estimates, uncertainty, diagnostics, assumptions, and limitations. |
| Code creation is a separate skill | Generates visible, reproducible R code from confirmed bindings. |
| Reporting requires copying between tools | Produces a report and audit/export package from the same analysis. |
| Learning and execution are separated | Teaches the method while guiding the user through the workflow. |
These are product design responses, not a claim that every catalog method is currently certified. Method-level claims remain bounded by current release evidence.
We'll load your dataset, explore its real variables, run an appropriate analysis, and show you the result, the executed output behind it, and the reproducible export.